Appearance
Built-In Analytics (Pro)
FluentPlayer Pro includes a powerful, built-in analytics dashboard that provides deep insights into how your audience interacts with your videos. Track everything from total plays and watch time to detailed per-video retention and geographic locations—all directly from your WordPress admin.
Pro feature
Built-in analytics is a FluentPlayer Pro feature, so you need to have FluentPlayer Pro installed and active to use it.
Why Track Video Analytics?
- Know what works See which videos get the most plays and watch time.
- Find drop off points See where viewers stop watching (retention data).
- Understand your audience See per user stats if viewers are logged in.
- Optimize content Use data to improve video length, topics, and placement.
How to Enable Built-In Analytics
To activate native tracking and access your private command center:
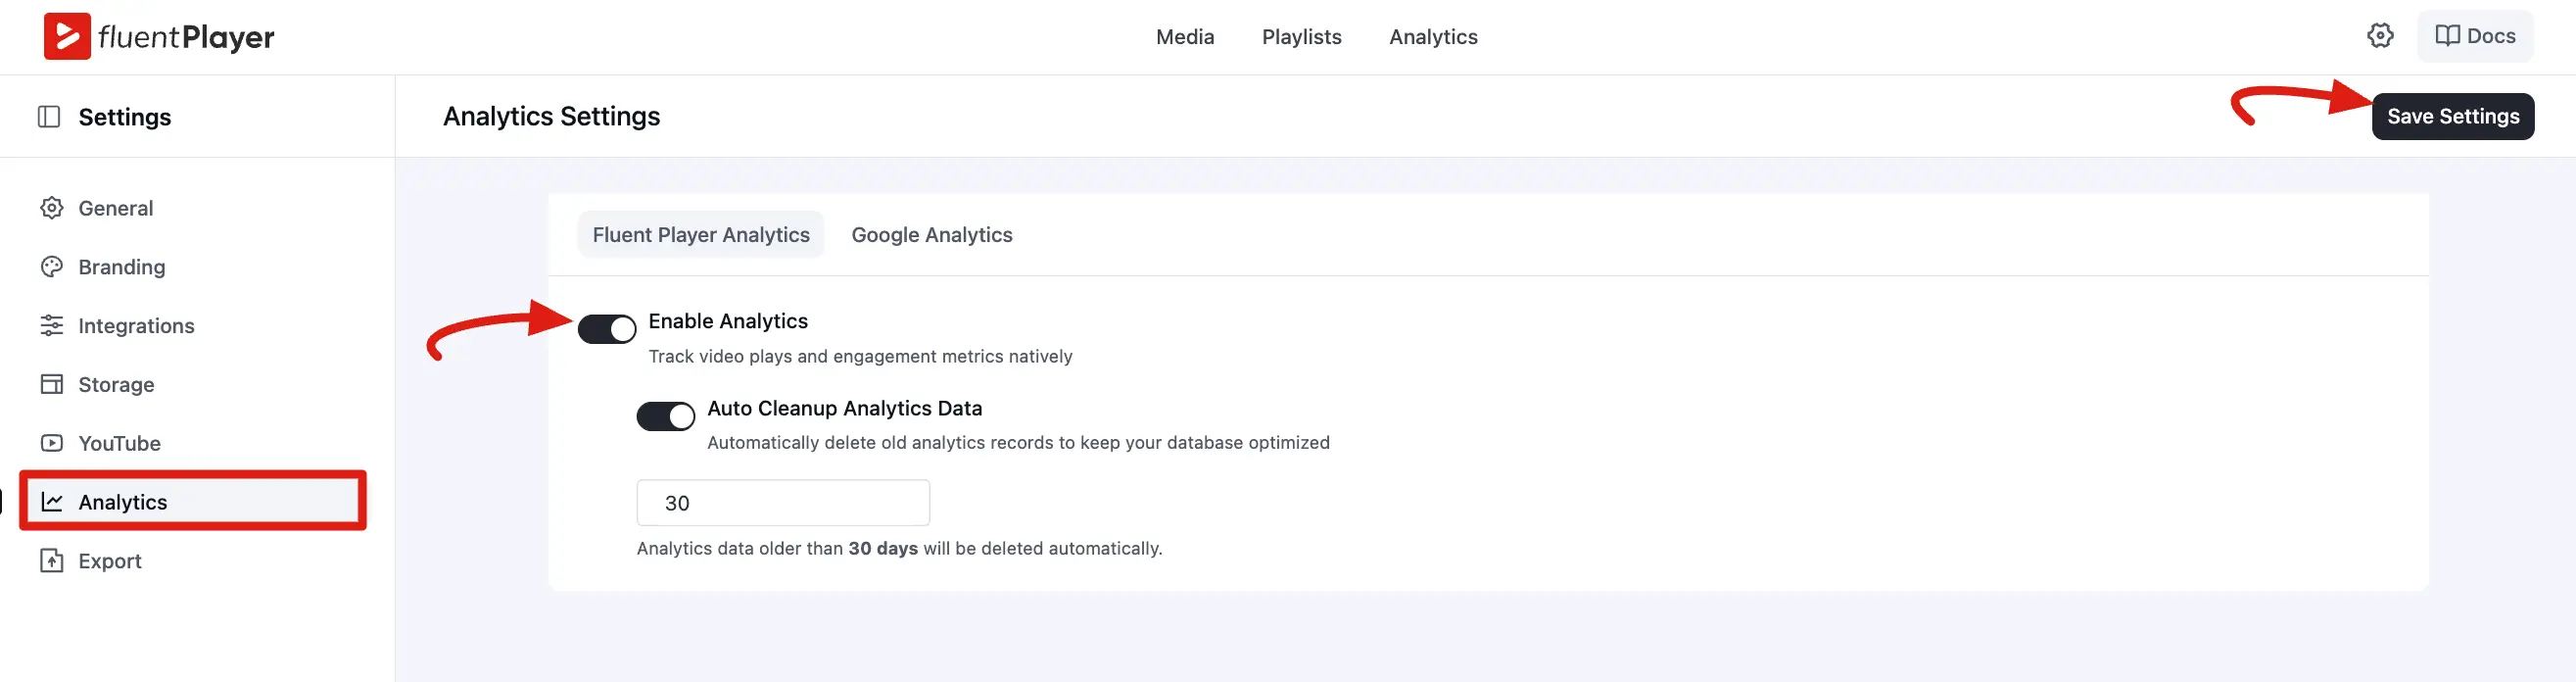
- Navigate to FluentPlayer Pro > Settings → Analytics.
- Stay on the FluentPlayer Analytics tab.
- Toggle Enable Analytics to the ON position.
- Click Save Settings in the top right corner.
Optional: Enable Auto Cleanup Analytics Data and set a Retention (days) period (e.g., 30 days) to keep your database fast and optimized.
After saving, a new Analytics menu item will appear in your WordPress sidebar under FluentPlayer Pro.
The Analytics Dashboard
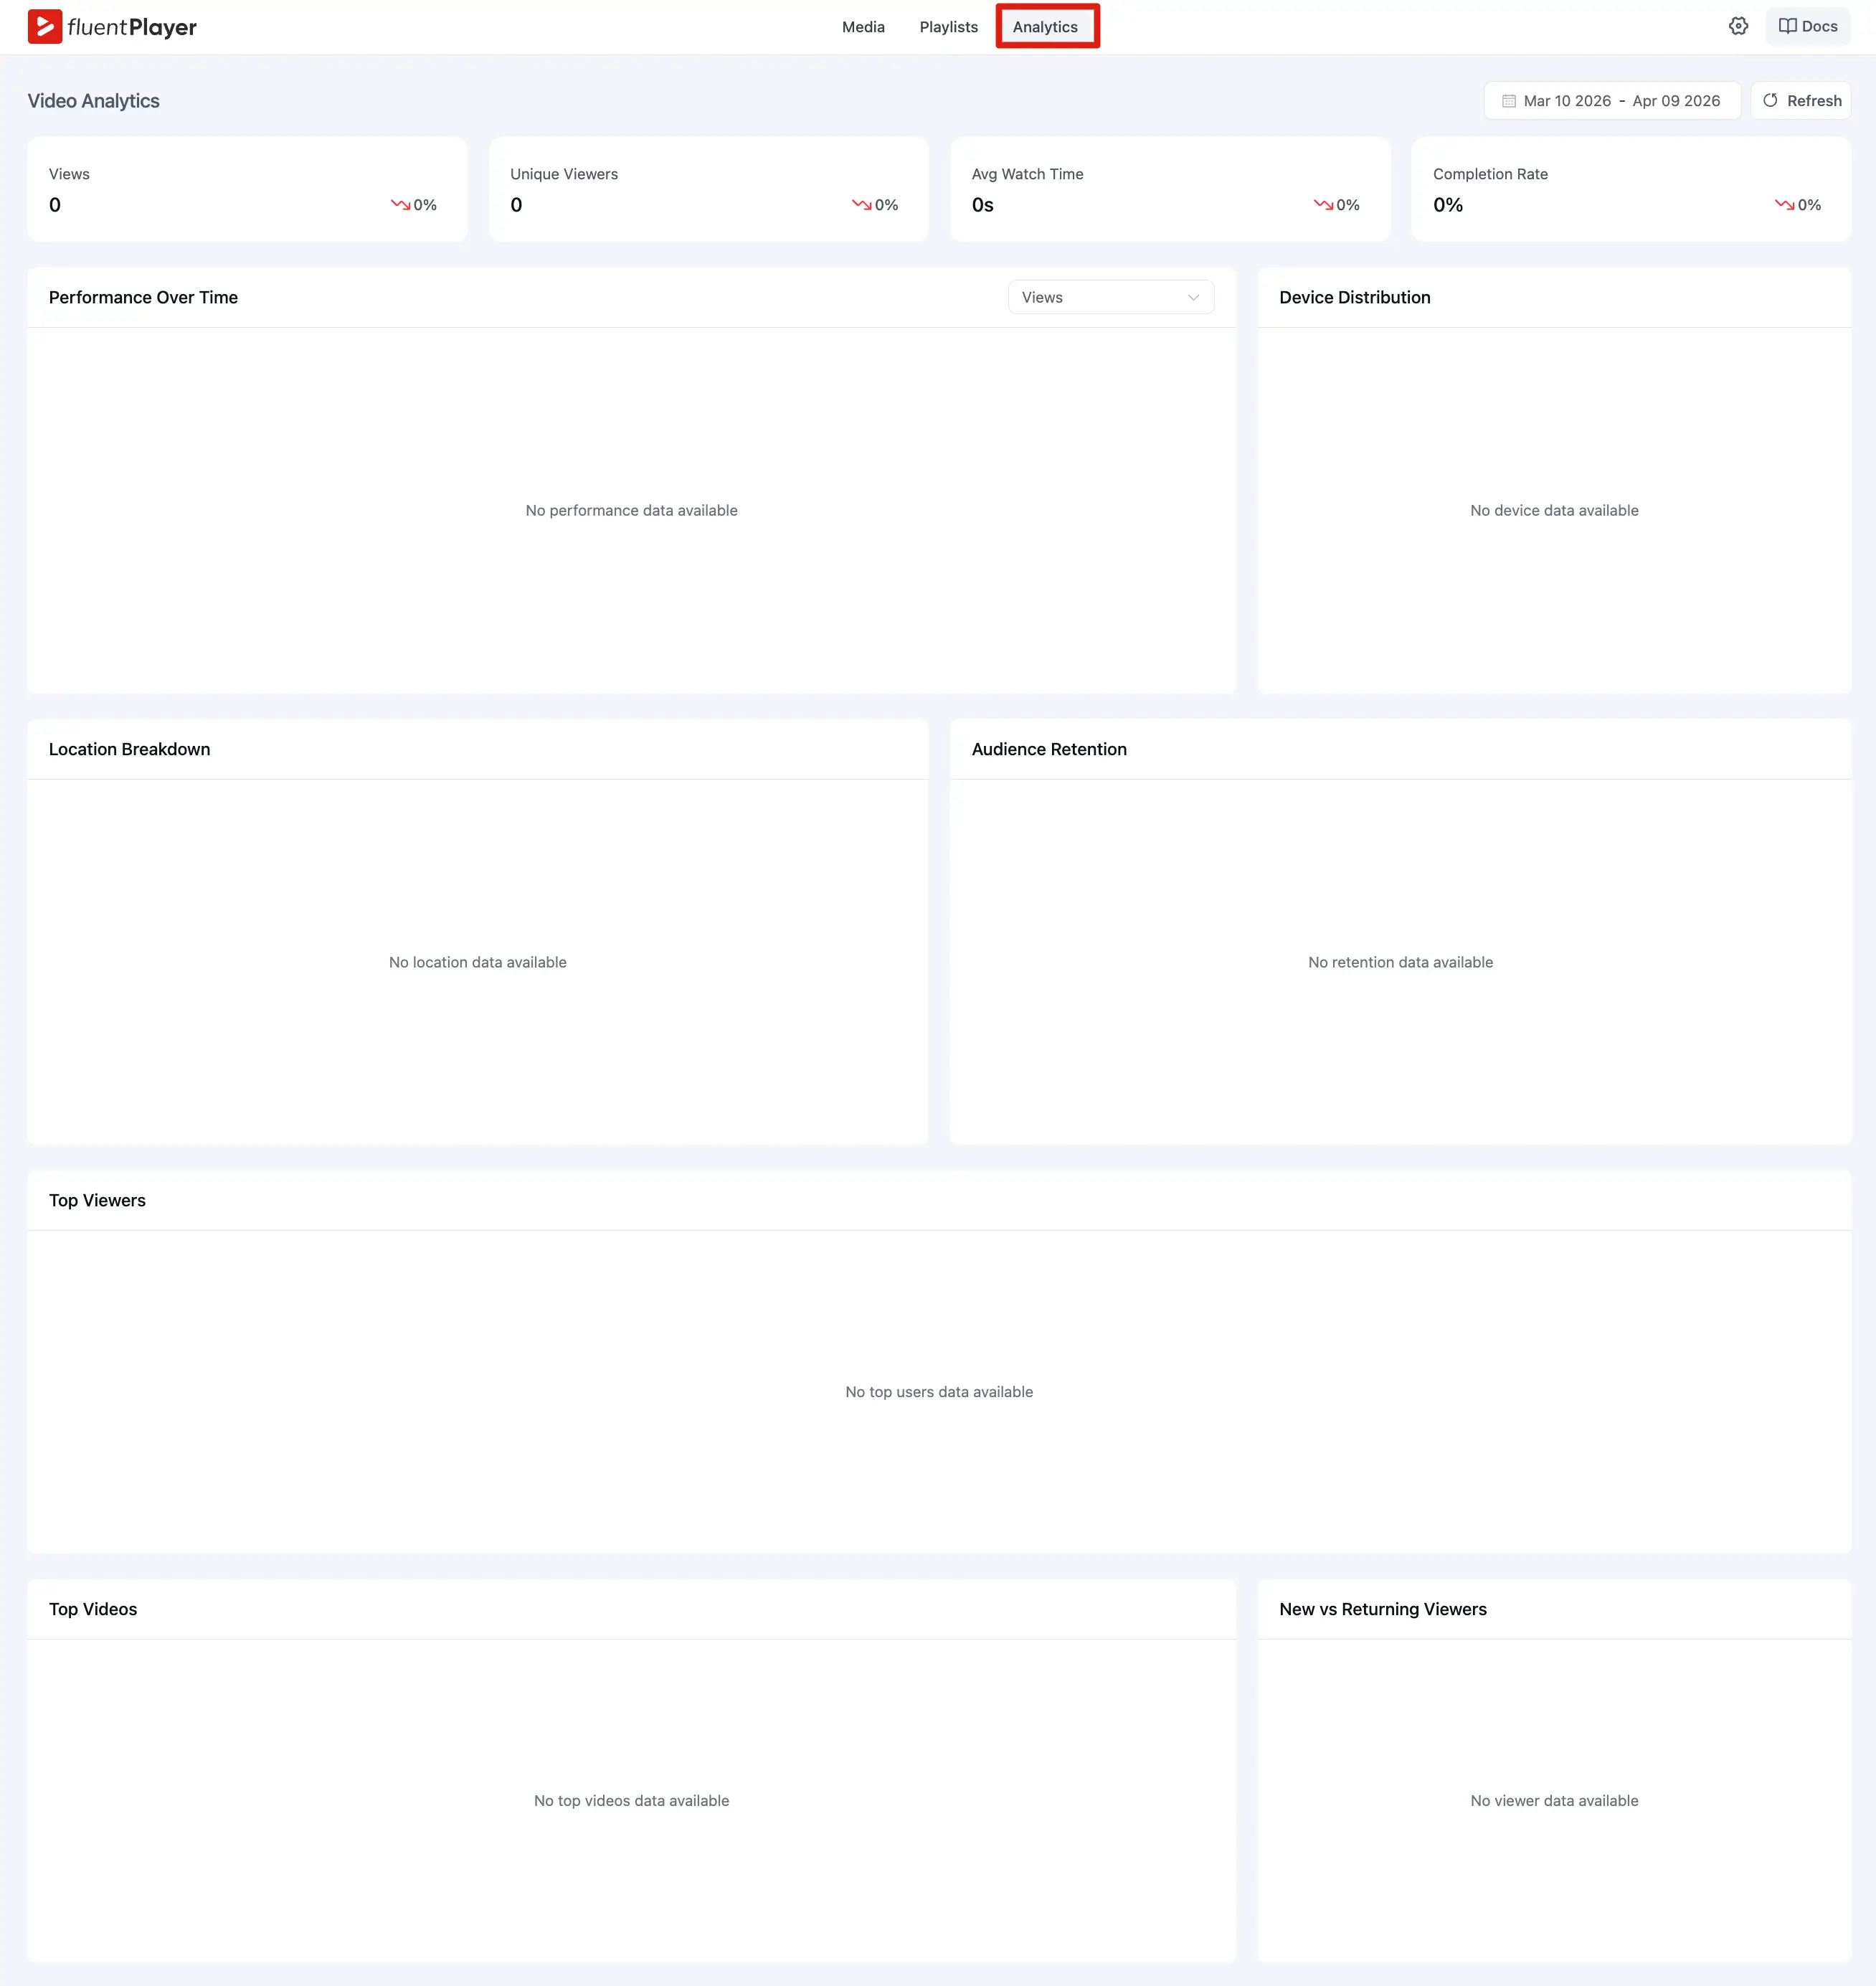
Once you have enabled analytics in the settings, you can view this data by going to FluentPlayer Pro > Analytics in your WordPress sidebar.
The dashboard serves as your central command center for video data. It is divided into several key visual areas:
- Overview: Displays high level summaries including Total Views, Unique Viewers, Avg Watch Time, and Completion Rate.
- Performance Over Time: A line chart that allows you to filter and view trends (like views or engagement) over specific date ranges.
- Device Distribution: A breakdown of whether your audience is watching on mobile, desktop, or tablet devices.
- Location Breakdown: A geographic map and list showing where in the world your viewers are located.
- Audience Retention: A specialized chart that shows the percentage of viewers remaining at every second of the video, helping you find where people drop off.
- Top Videos & Top Viewers: Ranked lists identifying your most popular content and your most active logged in users.
- New vs. Returning Viewers: A comparison chart showing how much of your traffic is from first time watchers versus loyal fans.
Per-user insights
For logged-in viewers, FluentPlayer can show per-user detail beyond the aggregate dashboard. From Top Viewers, you can drill into an individual viewer to see their activity — the videos they watched, how far they got, and their retention. This is useful for course creators who want to see exactly how a specific student is progressing.
Anonymous (logged-out) viewers are still counted in totals and unique-viewer metrics, but without a per-person profile.
Data retention & cleanup
Video tracking generates a lot of rows over time. To keep your database fast:
- Auto Cleanup Analytics Data — when enabled in Settings → Analytics, FluentPlayer automatically deletes stats older than the Retention (days) you set (for example,
30). - Orphan cleanup — when you delete a media item, its associated analytics records are cleaned up as well, so you do not accumulate stats for videos that no longer exist.
Analytics vs Google Analytics
| Built in Analytics | Google Analytics | |
|---|---|---|
| Where data lives | Your WordPress database | Google's servers |
| Dashboard | Inside WordPress admin | Google Analytics UI |
| Setup | Toggle on in Settings | Enter measurement ID |
| Detail level | Per video retention, per user stats | Event based (play, progress, complete) |
| Requires Pro | Yes | No (free) |
You can use both at the same time. Built in analytics give you WordPress native dashboards with rich detail. Google Analytics sends events to GA4 for broader marketing analysis.